
The Cone of Africa . . . Took Shape in Lisbon
By Patricia Seed | HUMANITIES, January/February 2008 | Volume 29, Number 6
Click on image to enlarge.
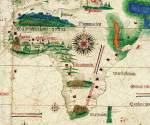
Detail of the Cantino Planisphere, showing Africa in its entirety in 1502. The world map by an anonymous Portuguese cartographer was secretly obtained by Alberto Cantino, a spy for the Duke of Ferrara, and taken to Italy. The map was recovered centuries later, hanging on the wall of a nondescript butcher shop.
Biblioteca Estense, Modena, Italy
The year that Christopher Columbus crossed the Atlantic and Isabel and Ferdinand expelled the Jews from Spain, an unheralded event took place. A cartographer in Lisbon, Portugal, drew an amazing map detailing the coasts of Europe, the Mediterranean, the Black Sea, and western Africa. The map reflected an explosion of knowledge of the known world, liberating Europeans from the narrow confines of the Mediterranean and launching the era of seafaring empires. Just as Einstein’s theory of relativity changed the perception of the universe, the mapping of Africa had repercussions that would change civilization forever.
The area the Lisbon map depicts is staggering. It spans more than 10 million square miles from 5 to 55 degrees north latitude and from 27 degrees present west to 41 degrees east longitude. At the top, Edinburgh’s Firth of Forth emerges, while to the south, the Volta River appears in eastern Ghana. On the west, the map displays the Azores, volcanic islands one-third of the way across the Atlantic and, on the east, Jerusalem and the shoreline of present-day Georgia in the Caucasus Mountains.
Unlike previous rough outlines, the map marks a technical milestone with the rendering of its large coastline. Drawn entirely by hand and completed in 1492, the contours of this map are instantly identifiable. Placed atop a modern map of the same region, the level of accuracy is startling. Europe and Africa look the way they do on a contemporary map today.
This sketch is arresting in another sense. At the time, most European geographers were following the tradition from the first century C.E., drawing Portugal as a brick and North Africa as a block. But this Portuguese cartographer was sketching sinuous coastlines, undulating back and around in rococo patterns. How did the mapmakers’ usual world of straight lines, sharp angles, and the occasional perfectly symmetrical circle become transformed into these extravagantly baroque curves? And how did they come to reflect the shape of Europe and Africa so successfully?
We know almost nothing about the man who created this masterpiece; we only have his unusually formed declaration of authorship. The cartographer did not sign the map or leave an impersonal sidebar to say that so-and-so drew this. Instead, the map announces its author with the words: “Jorge de Aguiar made me in Lisbon in the year of our Lord Jesus Christ 1492.” Other Portuguese maps from this era proclaim their designer in the same fashion, announcing, “Pedro Reinel made me,” the map thus speaking for itself and its maker.
This small inscription of authorship contains all the certain knowledge we have of the mapmaker. The biggest clue comes from his surname Aguiar, a town in northern Portugal near the River Douro. Beyond that location, scholars have identified two possible sets of relatives, taking independent directions regarding his identity. The first connection links him to Portuguese voyages. Two Aguiars married into the founding families of the Portuguese colonies on Madeira and Cape Verde Islands, and two different men surnamed Aguiar commanded eastward-bound ships; one led a vessel that foundered off the coast of Africa in 1502, and the other captained a small fleet that successfully sailed to India in 1508. However, the surname Aguiar also appears frequently in lists of Sephardim—Iberian Jews who were forced by the Inquisition to convert or leave, first Spain in 1492 and then Portugal in 1497.
The tale of how an obscure Portuguese map came to encompass so much of the known world in 1492 remains a mystery. No scratches, notes, or palimpsests appear, only the map itself. Nor have any written instructions or directions for building a map been found. In the history of mapping we know astonishingly little about this most important moment—the period when mapmakers learned to make charts to scale accurately. We do know when and where the process started and finished: beginning along the African coast sometime after 1434 and ending less than sixty years later with Aguiar’s map and others. Our failure to know much more about this process stems largely from nature’s wrath.
On a bright sunny, cloudless Saturday in 1755 two successive massive earthquakes devastated Lisbon. At 9:40 a.m., on the morning of November 1, the city was struck by what modern geologists have determined to have been a magnitude 8 earthquake, the same magnitude as the quake that destroyed San Francisco in 1906. But for Lisbon the trembling had only begun. Five minutes later, an earthquake perhaps as much as a hundred times stronger—over a magnitude 9—was provoked by the first. This mega thrust was similar in size to the December 26, 2004, shaking that triggered the massive and devastating tsunami in the Indian Ocean.
Lisbon would suffer the identical fate. Exactly an hour and a half after the first temblor, a wall of water more than sixty feet tall swept over the capital. Later that day, two more tsunamis battered the city, caused by the first earthquake and a powerful aftershock that followed. Estimates held that possibly half the city of Lisbon, some 100,000 people, died. Buildings of masonry and marble disappeared without a trace into the waters of the Tagus.
Hundreds of maps were stored in warehouses and government offices situated near the river; all were carried out to sea. At the same time, the records from the earliest African expeditions in the 1420s and 1430s were lodged several hundred miles south. In a singularly unfortunate trick of nature, these accounts resided in a building erected along the same fault as the one affecting Lisbon and even closer to the quake’s epicenter. In an instant, the tsunami that struck both places annihilated nearly all the geographic historical record of Europeans’ first mapping of Africa’s coast. While the country’s capital and commercial center was rebuilt, nothing remains of the palace housing the earliest accounts. The only maps that survived were copies and a handful of originals that happened to have been onboard ship, or in faraway private collections as Aguiar’s chart must have been. It is often said that history is composed by the winners; but it is equally true that history is written with the records that Mother Nature and men have spared.
The clues to Aguiar’s achievement must be found in the drawing itself. The sinuous lines wending their way across the parchment surface consist almost entirely of coastlines—with almost no details to represent the interior. These coastlines, in turn, are decorated with the names of locations placed at almost exactly right angles to the shoreline, creating the illusion of a densely inhabited coastal zone. In short, the colossal size and scale of this map is designed for sailing.
The tradition of densely filled sailing maps began two hundred years earlier, when the first such chart appeared depicting an area more than 970,000 square miles around the Mediterranean. Over the next one hundred and seventy years mapmakers gradually added to this chart, slowly marking the coasts of Europe, north to England and Ireland and usually no farther than the Low Countries on the continent. By 1492, Jorge de Aguiar and his fellow Portuguese cartographers had transformed a simple Mediterranean sea chart into a display ten times larger, accurately depicting 10 million square miles of the known world. But where his European coasts merely improved upon previous designs, his drawings of the African coasts were entirely new.
Less than sixty years before, maps of Africa depicted its Mediterranean coast and tiny slivers along the east and west. No sketch depicted the outline of Africa south of the Sahara on the west or south of the outline of the Red Sea in the east. Conjectures, however, abounded.
One group of mapmakers speculated that to the south, Africa consisted of a solid mass of land, ending somewhere near what we now know as Antarctica. Others imagined that a body of water, “the encircling ocean,” lay somewhere to the very south, again in the vicinity of present-day Antarctica. Neither was right—although beliefs in the encircling ocean came closer to reality. In truth, no one knew what lay to the south of these two edges—both factions were merely guessing.
Between 1434 and 1499 Portuguese navigators found the reality that lay beyond those two corners of the Sahara and the Red Sea; a cone-shaped continent surrounded on all sides by seas.
To sail around Africa, Portuguese pilots had to develop an entirely new repertoire of sailing techniques. In other parts of the world, sailors could safely follow regular winds, waves, weather, or the coast to reach their destinations. But at a promontory called Cabo Bojador (in Arabic Abu Khatar, meaning the “father of danger”) in what is presently western Sahara, sailors found themselves forced to sail out of sight of land.
Twelfth-century Arab geographer Al-Idrisi described this area as “the Sea of Darkness. . . . The sky is always overcast. . . . The waters of this sea are covered with cloud and dark in color. The waves are enormous, and the sea is deep. Darkness reigns continually, and navigation is difficult. The winds are violent and towards the west its limits are unknown.” Adding later, “No one knows what exists beyond this sea, no one has been able to learn anything for certain, because of the difficulty of crossing it, its profound darkness, the height of its waves, the frequency of its storms, the prevalence of its [sea] animals and the violence of its winds.”
Once at sea off Cape Bojador, ships were quickly drawn into a strong current that pulled them increasingly to the west, dragging them steadily away from the African coast and into the middle of the Atlantic. Voyaging southward down Africa’s coast required maneuvering against the winds, waves, and currents. Beginning with Gil Eanes’s rounding the promontory in 1434 (the fifteenth attempt by the Portuguese), sailors began following a counterintuitive course, moving east in order to travel south, and for the first time passing around the cape.
Starting in the 1420s, voyages initially sponsored by Prince Henry, nicknamed “The Navigator,” were launched with specific directions to collect information for maps. Maps visually recorded the distances, directions, and landmarks that previous sailors had encountered along the way, replacing the orally transmitted folk wisdom of pilots with a written record that could transmit knowledge of seas and routes expediently to a great number of individuals, allowing frequent journeys into the Atlantic and along the coast of Africa. Rumors of gold and other exotic goods in Africa’s interior were tantalizing to a kingdom that had few resources of its own—tempting enough to overcome superstition and fear of the unknown in order to get there.
Henry’s father, King John I, had recognized the importance of maps and sponsored the move to Lisbon of at least one prominent Jewish cartographer from the eastern Iberian kingdom of Valencia. In the wake of the first massacres of Jews in this region and growing anti-Semitism in the decades that followed, more Jewish cartographers fled to relative safety in Lisbon. The maps they made were held as carefully guarded state secrets, lest other European competitors beat the Portuguese to claim land and trade.
As instructed by Prince Henry, certain individuals onboard Portuguese ships made note of the natural landscape—beaches, groves of trees, dunes, and hilltops—sketching the height and shape of these features as seen from the deck of a ship. Each profile would allow explorers on subsequent expeditions to verify their locations by seeing if the contours of the land in the sketches matched up with what they could see. This practice remains a part of modern sailing.
On the voyages, outlines of bays, capes, peninsulas, islands, and river deltas would be sketched. Drawing the contours of each segment of coastline, sailors also measured the distances between these features. Each voyage would produce a new segment of the coastline. Slice by slice, trip by trip, these men accumulated the details of the coasts of Africa.
Back in Lisbon, professional mapmakers combined the information from each of these fragmentary drawings. At first the maps resembled jigsaw puzzles with separate sections of coast attached at odd angles. One small segment might be depicted in its true north-south direction while the following segment was attached at a slightly tipsy angle and the one after that tilting in an equally wrong but completely opposite direction. If you were to eliminate the bays and harbors that decorated these sketches, you would have a series of irregular zigzags—two zigs, one zag, one zig, two zags, and so on down the African coast.
But oceangoing voyagers were not likely to tolerate such irregularities for long. Sailors needed to discern the direction in which they were to travel, and they demanded to be able to identify the contours of the coasts they were following. Sailing to the northeast instead of the southwest could be costly in terms of lost time and supplies, assuming of course that the ship was not dragged out to sea, grounded on sandbars, or smashed on submerged rocks.
To construct larger maps, mapmakers stepped back from the careful detail inherent in the coastal sketches and transformed the coastline into a series of scalloped edges. These irregularly sized semicircles were no doubt intended to signal the bays and peninsulas that made up the coast of Africa, in recognition of the inherently nonlinear nature of seashores. Each of these scalloped-edged pieces was then placed end to end at the correct angle to the segment preceding it.
Each of these larger charts was constructed for a particular region. The west coast of Africa from the Strait of Gibraltar down to the westernmost tip of Africa at Cape Verde became one large segment. Another segment covered the entire Guinea coast from present-day Liberia in the west to Cameroon in the east. The third major segment stretched from Equatorial Guinea in the north to Angola in the south. One such map survives that combines the second and third segments together into a single chart from Liberia to Angola.
The next big step combined the first two segments from the Strait of Gibraltar to Cape Verde and then east along the Guinea coast. Then the original irregular shapes of the actual coastline could be restored, completing the transition back to the contours of earlier maps but without their fatal angular flaws.
What was the secret to establishing the correct direction to attach each successive segment? The key rested in the instrument Arabs had introduced into sailing the Mediterranean more than two hundred and fifty years before, the compass. Since a ship might sail in any direction, the compass occupied a complete circle, or 360 degrees with thirty-two equidistant lines radiating from the center, 11.25 degrees between each spoke.
In addition to sketching the shape of the peninsulas and bays, each drawing needed to indicate the direction of the coast, whether the coastline lay from east to west as it did along the Gulf of Guinea, or if it extended from northeast to southwest as it did along the Bulging Cape. However, because the compass relied upon magnetism to indicate direction, and magnetic north and true north did not always align, the compass sometimes misled the first coastal surveyors into believing that the coast lay one or two spokes in the wrong direction.
On the earliest charts, segments frequently appeared misaligned because the compass provided the wrong heading for a section of coastline. In order to have the segments of the African coast align properly, each segment had to have the correct bearing. Portuguese navigators soon realized the existence of magnetic variation—the difference between true north and magnetic north. Each of the segments added to the 1492 map contained the correction for local magnetic variation: otherwise each of the segments would be improperly aligned—much as they were in the charts of the 1460s and 1470s.
One piece of evidence for the early Portuguese mastery of measuring magnetic variation comes from the better known figure of 1492, Christopher Columbus. Having married into a prominent trading family on the island of Porto Santo, Columbus took part in numerous Portuguese expeditions, including one lengthy journey along the Guinea coast in the early 1480s. Later, in his journal of his trip to the West Indies, he frequently mentioned corrections he made for magnetic variation as he barreled westward into the Atlantic. Another confirmation of Portuguese expertise is in the first map of the entire African continent just after 1500, which contains a place named Cape of the Needles (Cabo das Agulhas), as a Portuguese navigator explained, because at that point, the southernmost tip of the African continent, magnetic north and true north are indistinguishable.
A decade after Columbus set foot in the New World and Jorge de Aguiar finished his map, the first single chart of Africa’s 16,000-mile coastline appeared, including nearly 10,000 miles that had been added in less than seventy years. The entire shape of the African continent emerged, the inverted cone, surrounded—as hundreds of sailors could attest—almost entirely by water.
The accomplishment remains nothing short of spectacular. After learning to draw large-scale maps of coastlines for Africa, these same Portuguese cartographers, including Pedro Reinel and his son Jorge, were some of the first to map the Americas.
Portuguese maps of this era were both method and mirror, establishing the direction and distance in which ships should travel while at the same time displaying Europe’s astounding overseas spread. Maps enabled Europeans’ increasingly far-flung forays overseas, depicting the places they had visited in pursuit of wealth. Maps constituted the crucial means by which Europeans launched seafaring empires and established a truly global economy. Crossing hundreds of miles of ocean, gold began to arrive in Europe in greater quantities than had been seen in several centuries, as did salt, ivory, and pepper.
But the seaborne trade also included humans, exported from Africa in increasing numbers across far greater distances than before, becoming slaves in Europe, the Atlantic islands, and the New World. The maps that illuminated the sea routes and ports of Africa would be used just as easily to expedite the trade in humans as they were to facilitate commerce in ivory and gold.
Patricia Seed is a professor of history at the University of California, Irvine. She is the author of Ceremonies of Possession in Europe’s Conquest of the New World, American Pentimento: The Invention of Indians and the Pursuit of Riches (winner of American Historical Association’s prize in Atlantic History), and more recently José Limón and la Malinche: The Dancer and the Dance. Seed received an NEH Digital Start-Up Grant to digitize a rare collection of Portuguese maps from 1434–1504 for general and scholarly use. View an early version of the grant’s website.
KEYWORDS:AfricaCartographyExplorationPortugalSailing
